You’ve poured your heart and soul into crafting the first version of your product. It’s lean, it’s functional, and it’s finally live in the hands of real users. For many founders, this is the moment they’ve been waiting for—the "big reveal." But here’s the uncomfortable truth that few want to acknowledge: Building the product is only the starting line.
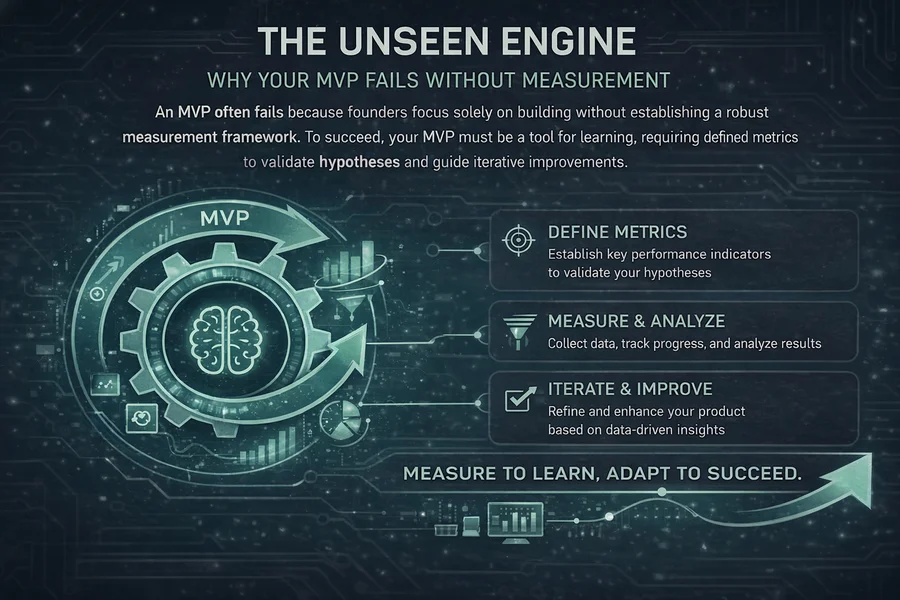
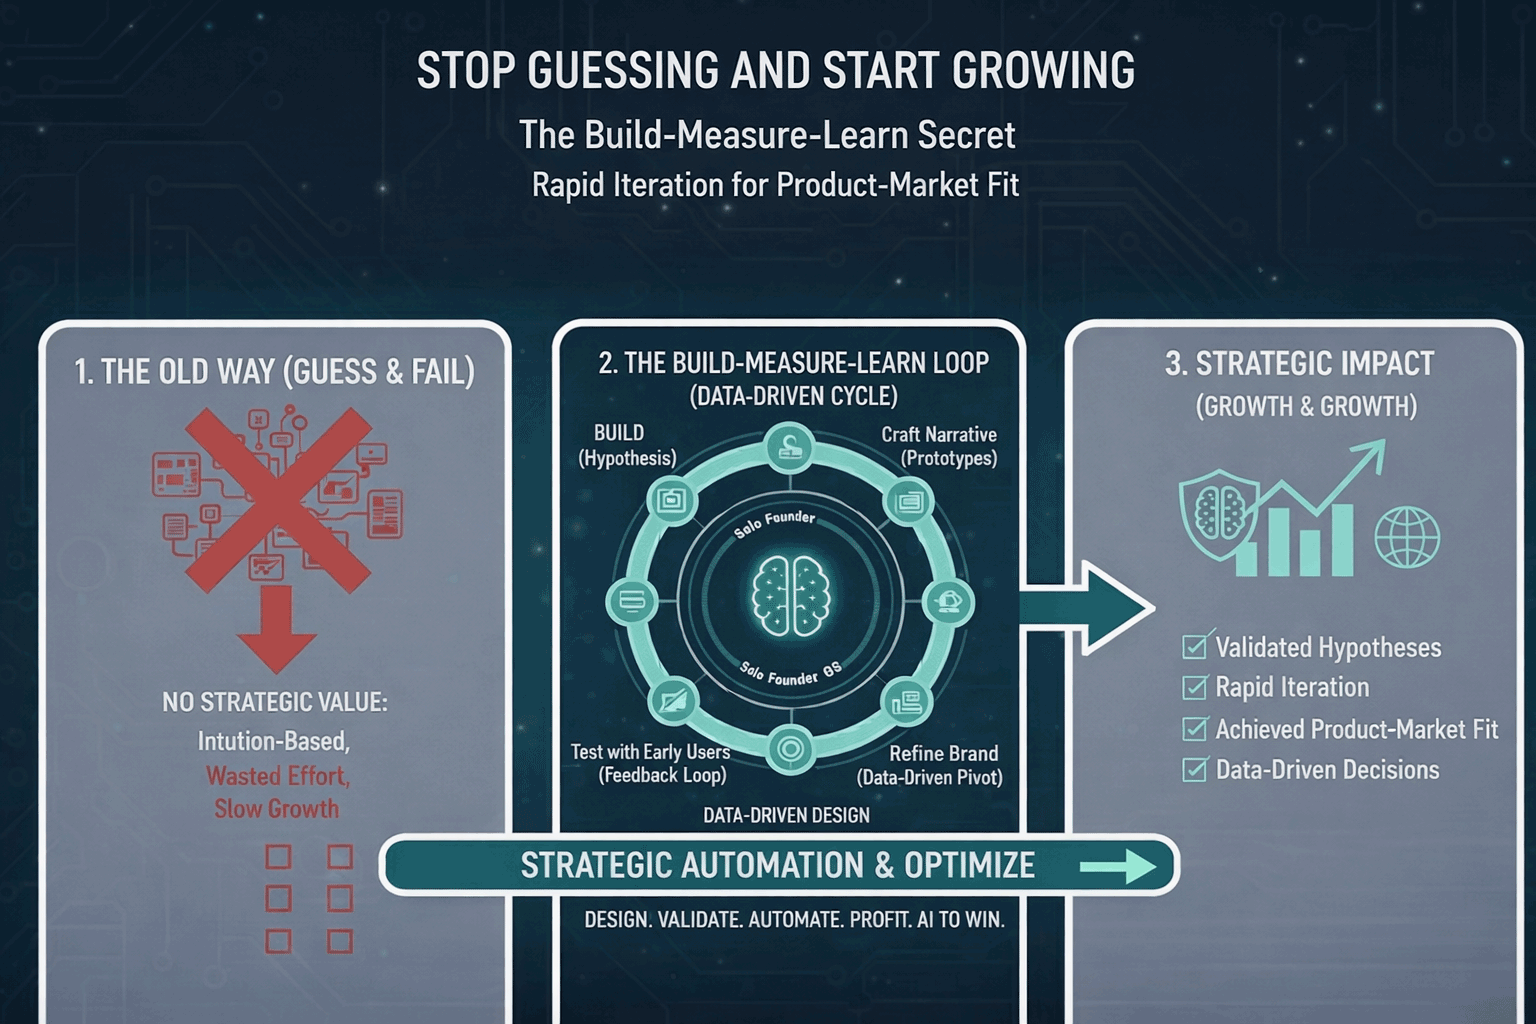
In the Lean Startup methodology, the "Build" phase is simply the mechanism required to get to the "Measure" phase. It is a means to an end. If you aren't measuring with scientific rigor, you aren't "doing Lean"—you're just building software in the dark and hoping for a miracle. For solopreneurs and early-stage founders, especially those bootstrapping with limited runway, every decision carries the weight of survival. Wasting three months on a feature that 80% of your users ignore isn't just a minor "learning experience"—it’s a direct threat to your company's existence.
This is where robust measurement becomes your most powerful ally. It moves you away from faith-based entrepreneurship, where decisions are made by the "Highest Paid Person's Opinion" (HiPPO), and toward evidence-based growth. Think of your MVP as a scientific experiment. You have a hypothesis about a customer problem and a proposed solution. In the laboratory of the open market, your product is the stimulus, and user behavior is the reaction. To prove or disprove your hypothesis, you need data. This post explores how to identify the right metrics, implement Innovation Accounting, and build a measurement stack that guides your next pivot.
1. The Trap of Vanity Metrics vs. Actionable Metrics
Before selecting tools or building dashboards, we must address the "Metric Trap." As a founder, it is psychologically seductive to fall in love with numbers that make you look successful but tell you nothing about the fundamental health of your business. Eric Ries, the father of the Lean Startup movement, famously labeled these Vanity Metrics.
The Deceptive Allure of Vanity Metrics
Vanity metrics are the "feel-good" numbers. They are the stats you put in a press release or tell your family about to prove you’re a "real entrepreneur." However, they lack context, causality, and depth.
- Total Registered Users: This number only goes up. It doesn't tell you if people are actually using the product today. You could have 10,000 sign-ups, but if 9,900 of them left after thirty seconds and never returned, you don't have a business; you have a well-designed landing page.
- Raw Page Views: High traffic is great for the ego, but if those visitors aren't engaging with your core value proposition, your website is just a digital billboard that people are driving past at 80 mph. Traffic without engagement is just a drain on your server resources.
- Social Media Followers: "Likes" and "Retweets" do not equal "Life-time Value (LTV)." Unless those followers are converting into active users who find value in your product, they are a distraction that consumes your marketing time.
The danger of vanity metrics is that they provide a false sense of security. You might see a 20% month-over-month growth in sign-ups and think you're winning, while failing to notice that your Churn Rate—the rate at which people quit—is 95%. This leads to the "Sinking Ship" scenario: you keep pouring water (marketing spend and effort) into a boat that has a massive hole in the bottom. You feel busy, but you aren't actually moving forward.
The Power of Actionable Metrics
Actionable metrics are numbers that tie specific, repeatable actions to observed results. They tell you exactly what to do next. If the metric is down, you know exactly where the friction is. They are the "check engine" lights of your startup. Examples include:
- Conversion Rate of a Specific Funnel: For example, "What percentage of people who see the pricing page actually enter their credit card information?" If this drops, you know the issue is likely price sensitivity or a lack of trust, not your top-of-funnel marketing.
- Cohort Retention: This is the gold standard of early-stage metrics. "Of the users who joined in January, how many are still active in March?" If each new month's "cohort" stays longer than the last, you are objectively making the product better.
- Per-User Engagement (The "Aha!" Moment): "How many 'Tasks' does the average user complete in their first 48 hours?" This measures the point where the user realizes the value of your product. If this number is low, your onboarding process is failing.
2. Identifying Your North Star: The KPI Framework
The sheer volume of potential data can be paralyzing. Modern analytics tools can track every click, scroll, and hover. The key to surviving this information overload is to focus on your North Star Metric—the one piece of data that best represents the core value your customers receive. This should be tied directly to your fundamental business hypothesis.
Case Study A: The Freelance Task Manager
Hypothesis: Freelancers struggle to track billable hours accurately and will pay for a "one-click" solution that saves them time during invoicing.
- Wrong Metric: Total number of new accounts created. This only measures how good your ad copy is.
- Actionable Metric (North Star): Percentage of users who log at least 5 hours of work in their first week. If this is high, you have found "Product-Market Fit" for your core feature. If it's low, your "one-click" solution might be hidden, or the initial setup is too intimidating.
Case Study B: The Local Artist Marketplace
Hypothesis: Local buyers want to support neighborhood artists but don't know where to find them or how to buy securely.
- Wrong Metric: Total number of art listings. This measures supply, but an empty store with a thousand products is still a failing store.
- Actionable Metric (North Star): Inquiry-to-Sale Conversion Rate. This measures the "liquidity" of your market. It tells you if you are attracting "window shoppers" or "collectors." If inquiries are high but sales are low, your checkout process likely needs a total overhaul.
Actionable Tip: Before writing a single line of code for a new feature, ask your team: "What specific metric will this feature improve?" If you can't name it—and explain the logic of how it will move—don't build it. You’re just adding "feature bloat" that will make your product harder to use.
3. Implementing Innovation Accounting
Standard accounting measures things like profit, loss, and cash flow. While vital for a mature business like Starbucks or Ford, these are "lagging indicators" for an MVP. By the time your bank account hits zero, it’s too late to learn what went wrong. Innovation Accounting is a way of evaluating progress when you are operating in a state of extreme uncertainty.
It works in three disciplined steps:
- Establish the Baseline: Use your MVP to gather real data on where your product stands right now. For example, your baseline might be that only 10% of users complete the onboarding process. This is your "brutal honesty" phase. It gives you a starting point to improve upon.
- Tuning the Engine: Every subsequent effort—be it a marketing campaign, a design tweak, or a new sub-feature—should be aimed at improving that baseline. If you change the onboarding text and the rate moves from 10% to 15%, you have achieved validated learning. You have evidence that your change actually mattered to the user experience.
- Pivot or Persevere: If you keep "tuning the engine" but the metrics refuse to move, it’s a sign that your fundamental hypothesis is wrong. No amount of changing the color of a "Sign Up" button will fix a product that nobody actually needs. This is the signal that you need to pivot.
Innovation Accounting protects you from the "Success Theater" that often kills startups. It’s easy to tell investors that things are going great because traffic is up, but Innovation Accounting forces you to admit that if retention isn't moving, the business isn't growing. It provides the cold, hard data needed to stop and change direction before you run out of capital and spirit.
4. Building Your Measurement Stack (On a Budget)
You don't need a data science team or a $5,000 monthly software budget to get high-quality insights. For a solopreneur, the goal is a "Goldilocks" stack: enough data to be dangerous and informed, but not so much that you spend all day in spreadsheets instead of building your product.
A. Quantitative Tools (The "What")
These tools tell you what is happening in your product. Google Analytics 4 (GA4) is the free standard, but its learning curve can be steep for beginners. If you want to spend more time building and less time configuring complex tags, consider Plausible or Fathom. These are privacy-focused, lightweight, and show you the essentials (referrals, top pages, bounce rates) on a single, easy-to-read page.
For in-app behavior tracking—knowing that a user clicked "Export" but then abandoned the page before the download finished—Mixpanel or Amplitude are superior. They allow you to build "Funnels" to see exactly where users get stuck in your process. Most of these tools offer generous free tiers for your first few thousand users.
B. Qualitative Tools (The "Why")
Quantitative data tells you that 50% of people leave your sign-up page. It doesn't tell you if they left because they were confused by the copy, because the page loaded too slowly, or because they didn't like your brand colors. To find out, you need qualitative context:
- Hotjar or Microsoft Clarity: These provide "Heatmaps" and "Session Recordings." You can watch a video of a real user's cursor hovering over a button, hesitating for ten seconds, and then clicking away. It is the fastest way to build empathy for your users and identify UI friction.
- Tally or Typeform: Use these for "Micro-Surveys." Instead of a 20-question survey that everyone ignores, ask one targeted question: "What’s the one thing that almost stopped you from signing up today?" The answers will provide the "Why" behind your bounce rates.
C. The "Concierge" Method (Unscalable but Vital)
In the early days, the best measurement tool isn't software—it’s direct human conversation. Reach out to your first 50 users personally. Offer them a $10 gift card or a lifetime discount for a 15-minute Zoom call. Observe them using the product via screen share without giving them instructions. You will learn more in ten minutes of watching a user struggle to find your "Save" button than in ten hours of looking at a Google Analytics dashboard. This "unscalable" measurement provides the context that raw numbers never can.
5. The Discipline of the Weekly Metric Review
Measurement is a muscle; it atrophies if not used. If you only look at your dashboard once a quarter when you're feeling stressed about your runway, you aren't using data to drive your business; you're just performing a post-mortem on a dying startup. To truly embrace the Lean Startup cycle, you must hold a Weekly Metric Review.
Every Monday morning, before checking your email or your Slack messages, look at your North Star and your supporting KPIs. Ask these three questions of yourself and your team:
- What changed since last Monday? Did a specific number move significantly? Don't just look at the direction; look at the magnitude of the change.
- Correlation vs. Causality: What did we build or launch last week? Can we tie that specific action to the change in the metric? If we changed the homepage headline and the conversion rate went up 5%, we have a win. If it stayed the same, our copy didn't resonate.
- The "One Thing" Rule: Based on this week's data, what is the single most important thing we can build or fix this week to move the needle? If onboarding is the bottleneck, stop working on new features and fix the onboarding.
This creates a tight feedback loop. Instead of planning a rigid six-month roadmap that might be based on a false assumption, you are navigating like a pilot, making small, constant adjustments based on the "weather" of user data. It ensures that your Build phase is always fueled by the Measure phase, preventing wasted effort.
6. Common Measurement Pitfalls to Avoid
Even with the right mindset, measurement can go wrong. Here are the most common traps founders fall into:
- Measuring Everything: "Data fatigue" is real. If you track 50 different metrics, you won't be able to see the forest for the trees. Focus on 3-5 that actually drive growth.
- Confirmation Bias: It is tempting to look for the one data point that proves you are right and ignore the ten that prove you are wrong. You must be willing to let the data "break your heart" occasionally.
- Ignoring Small Samples: Early on, you won't have "statistical significance." That's okay. If 4 out of 5 users tell you they hate a feature, you don't need a thousand more users to tell you it's broken. Act on the signal you have.
Conclusion: Measurement is Liberty
Founders often resist measurement because they’re afraid the data will tell them their "baby" is ugly. They worry that low engagement numbers mean they've failed as entrepreneurs. But in the Lean Startup world, the only true failure is the failure to learn.
Low metrics are not a death sentence; they are a roadmap. They tell you exactly where your product is broken so you don't have to stay awake at night guessing how to fix it. When you embrace measurement, you gain the freedom to stop worrying about being "right" and start focusing on being informed. You move from a place of founder-anxiety to a place of strategic authority.
Next Step: Pick one metric today—just one—that represents the core value of your product. Set up a way to track it (even if it's just a manual tally in a spreadsheet), and commit to checking it every Monday morning for the next month. Don't worry about the other noise; just watch that one number. If it moves in the right direction, you're winning.
Your MVP is a vehicle designed to take you to a successful business. The "Build" phase is the engine, but the "Measure" phase is the steering wheel. Without it, you're just driving fast into a brick wall. By measuring what matters, you ensure that every drop of your entrepreneurial energy is spent building something that the world actually wants and is willing to pay for.
No comments yet
Be the first to share your thoughts on this article!