Innovation Accounting & Decision Making
Stop making startup decisions based on gut feelings. Track validation progress, accumulate evidence, and make confident Pivot/Persevere/Kill decisions with systematic Innovation Accounting.
90% of startups fail not because they couldn't build—but because they built the wrong thing. Innovation Accounting gives you a systematic framework to validate before you commit, and make decisions based on evidence rather than emotions.
The Problem: Decision Paralysis & Gut-Feel Pivots
Sound familiar?
- "We've been working on this for 6 months but I'm not sure if we should keep going or pivot..."
- "Our investors are asking for data but we just have a feeling this is the right direction."
- "We killed that feature too early / too late—we'll never know if it could have worked."
- "Our team has different opinions on what the customer feedback means."
The cost: Months of wasted effort, depleted runway, team burnout, and missed opportunities.
What is Innovation Accounting?
Innovation Accounting is a systematic methodology from The Lean Startup that transforms how you make startup decisions. Instead of relying on vanity metrics and gut feelings, you:
Master the theory behind Innovation Accounting in our free Startup Foundations Playbook—covering VML levels, Learning Velocity, OMTM, and more.
Track Systematically
Document every hypothesis, experiment, and piece of evidence in one organized system.
Never lose a learning againMeasure Learning
Quantify your learning velocity--how fast you're validating or invalidating assumptions.
Data-driven progress trackingDecide Confidently
Make Pivot/Persevere/Kill decisions backed by accumulated evidence, not emotions.
Evidence-based decisions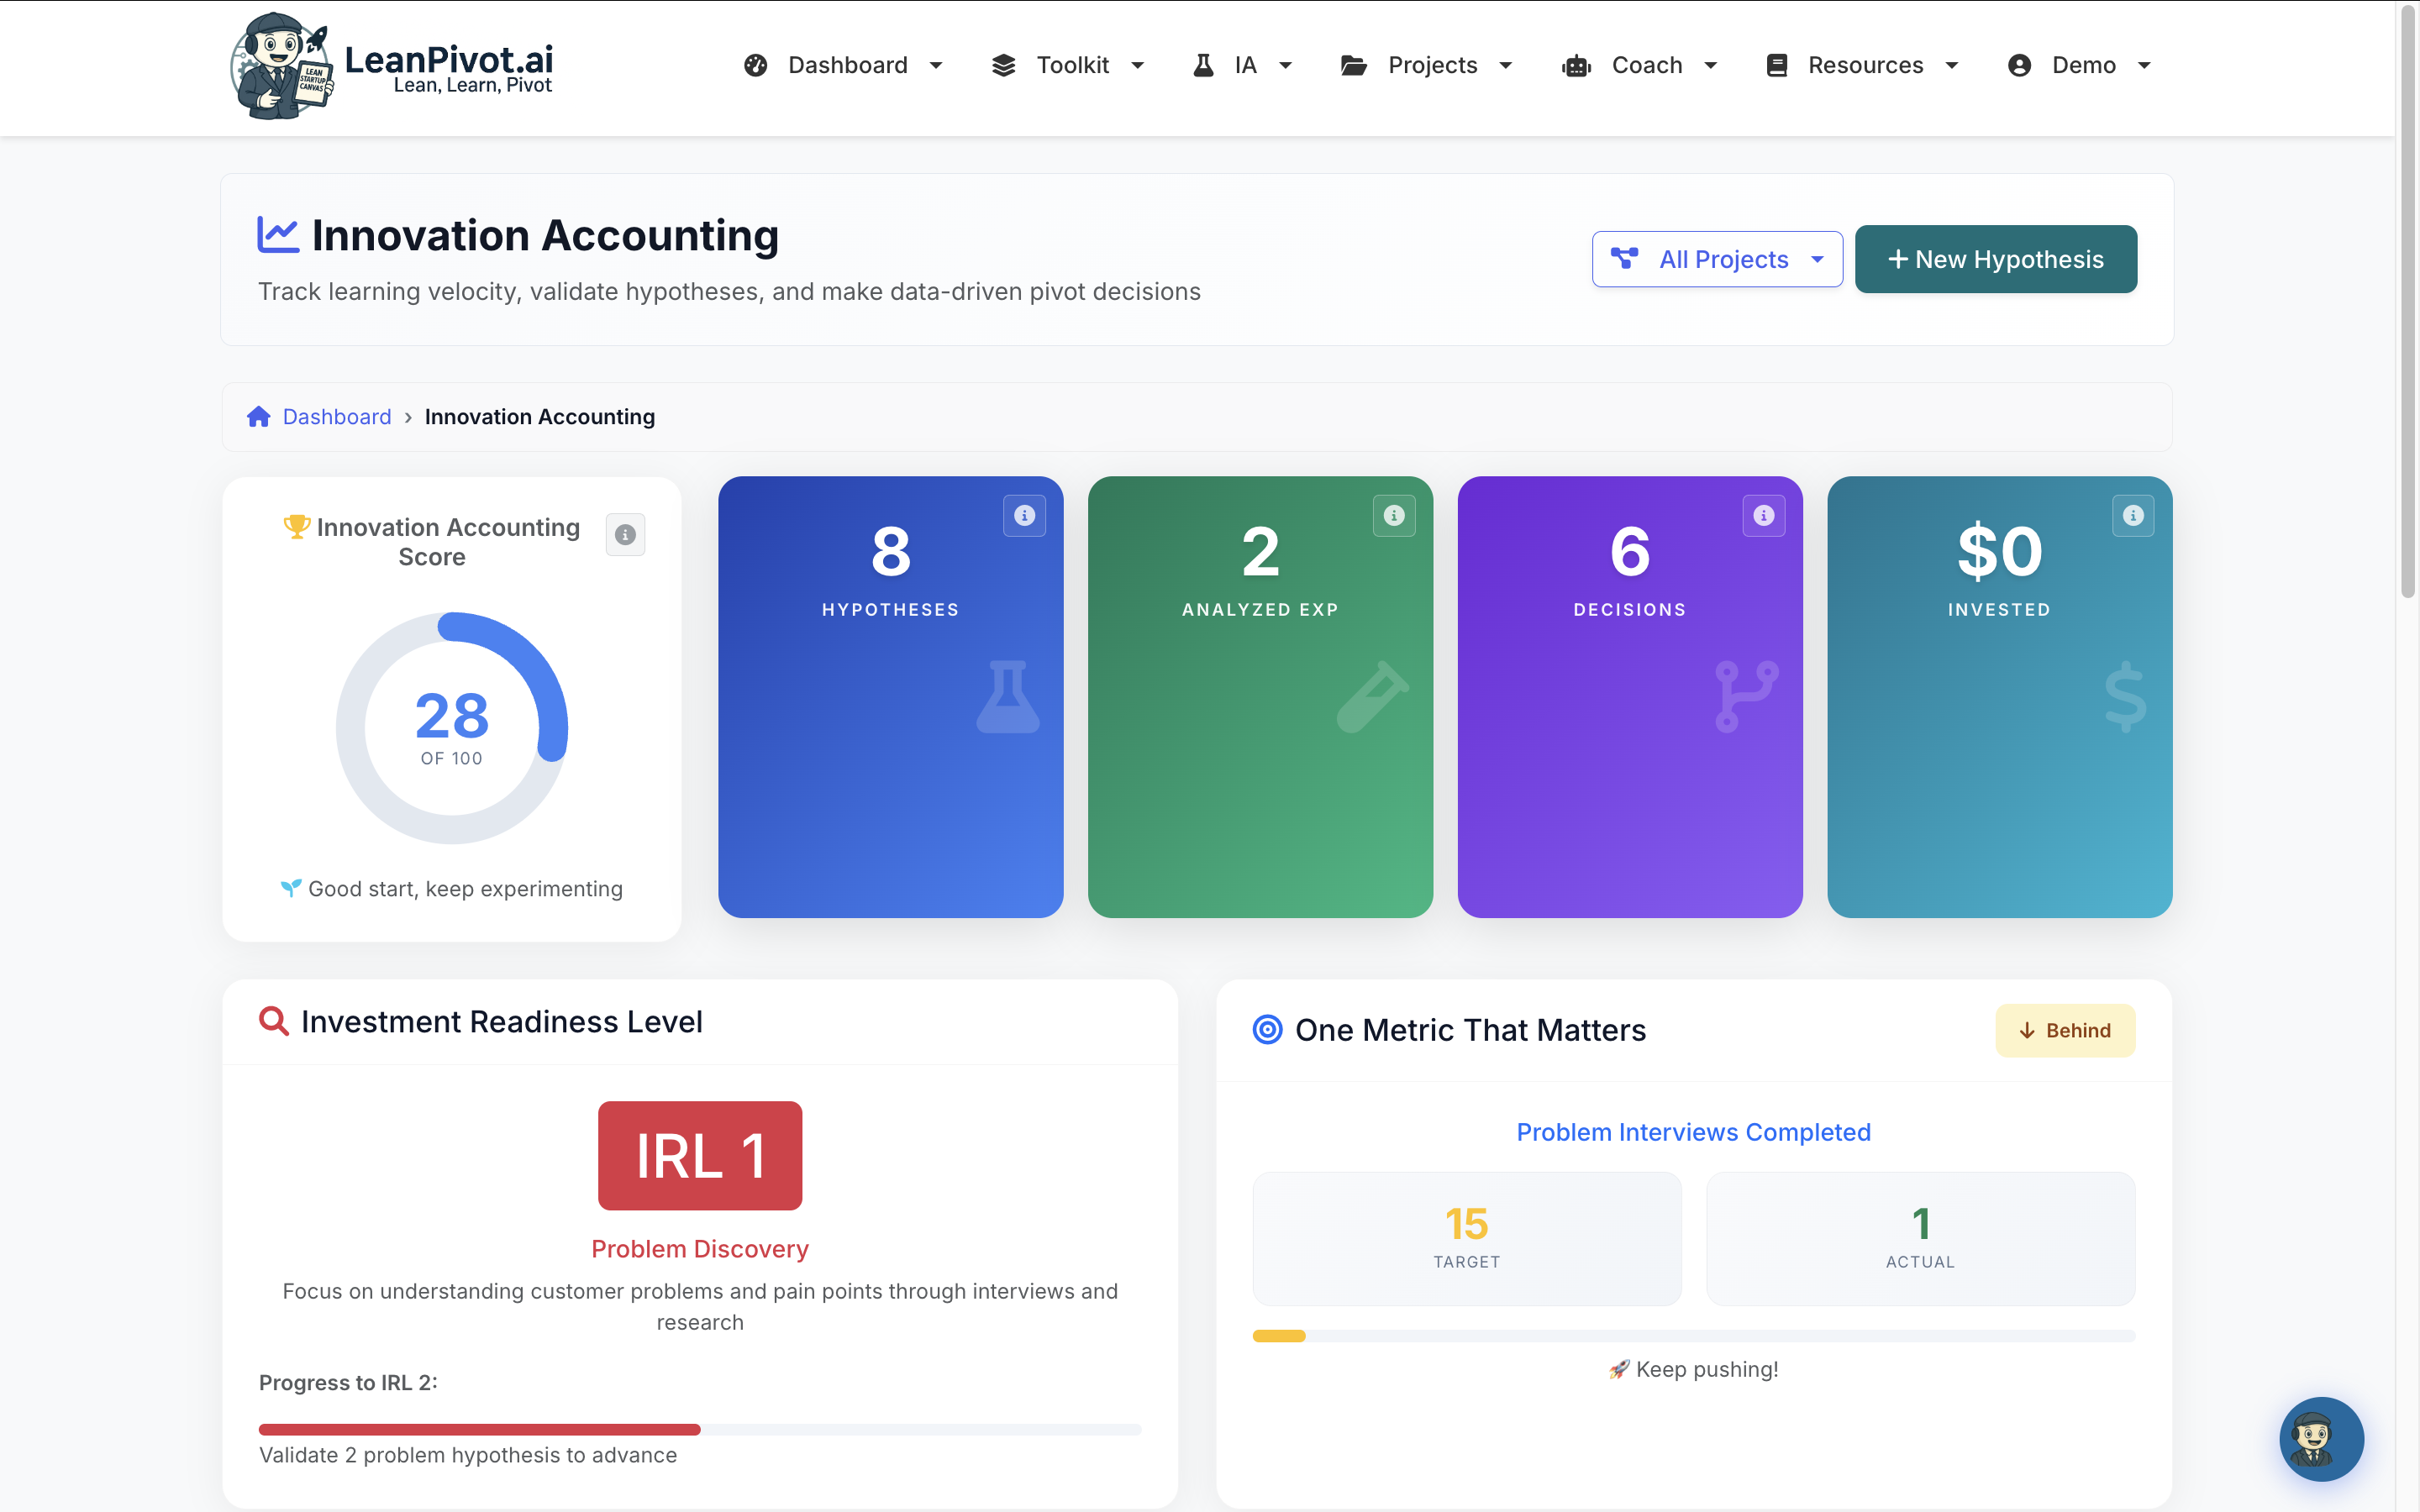
Track your Innovation Score, Validation Maturity Level (VML), and One Metric That Matters (OMTM) all in one dashboard
The Validation Lifecycle
Every startup idea goes through a systematic progression from raw concept to confident decision:
At each stage, you accumulate evidence that either validates or invalidates your assumptions. When you have enough evidence, you make a confident decision to pivot, persevere, or kill the idea.
Decision Making: Pivot, Persevere, or Kill
The heart of Innovation Accounting is making structured decisions. Our Decision Review system helps you document and track every major decision:
Persevere
When to use: Evidence supports your hypothesis. Customers want this. Business model works.
Action: Double down. Scale what's working. Set SMART execution goals.
Pivot
When to use: Core hypothesis is wrong, but you've learned something valuable to redirect.
Action: Change direction strategically. New hypothesis, new experiments.
Kill
When to use: Evidence clearly shows this won't work. No viable pivot path.
Action: Archive learnings. Free up resources. Move to next opportunity.
Complete Decision Types
Six structured decision categories cover every possible outcome of your validation work.
- Continue Testing - Need more evidence before deciding
- Persevere - Validated, moving forward
- Pivot - Strategic direction change
- Kill - Stop and archive learnings
- Merge/Split - Combine or divide hypotheses
- Pause - Shelve for later reconsideration
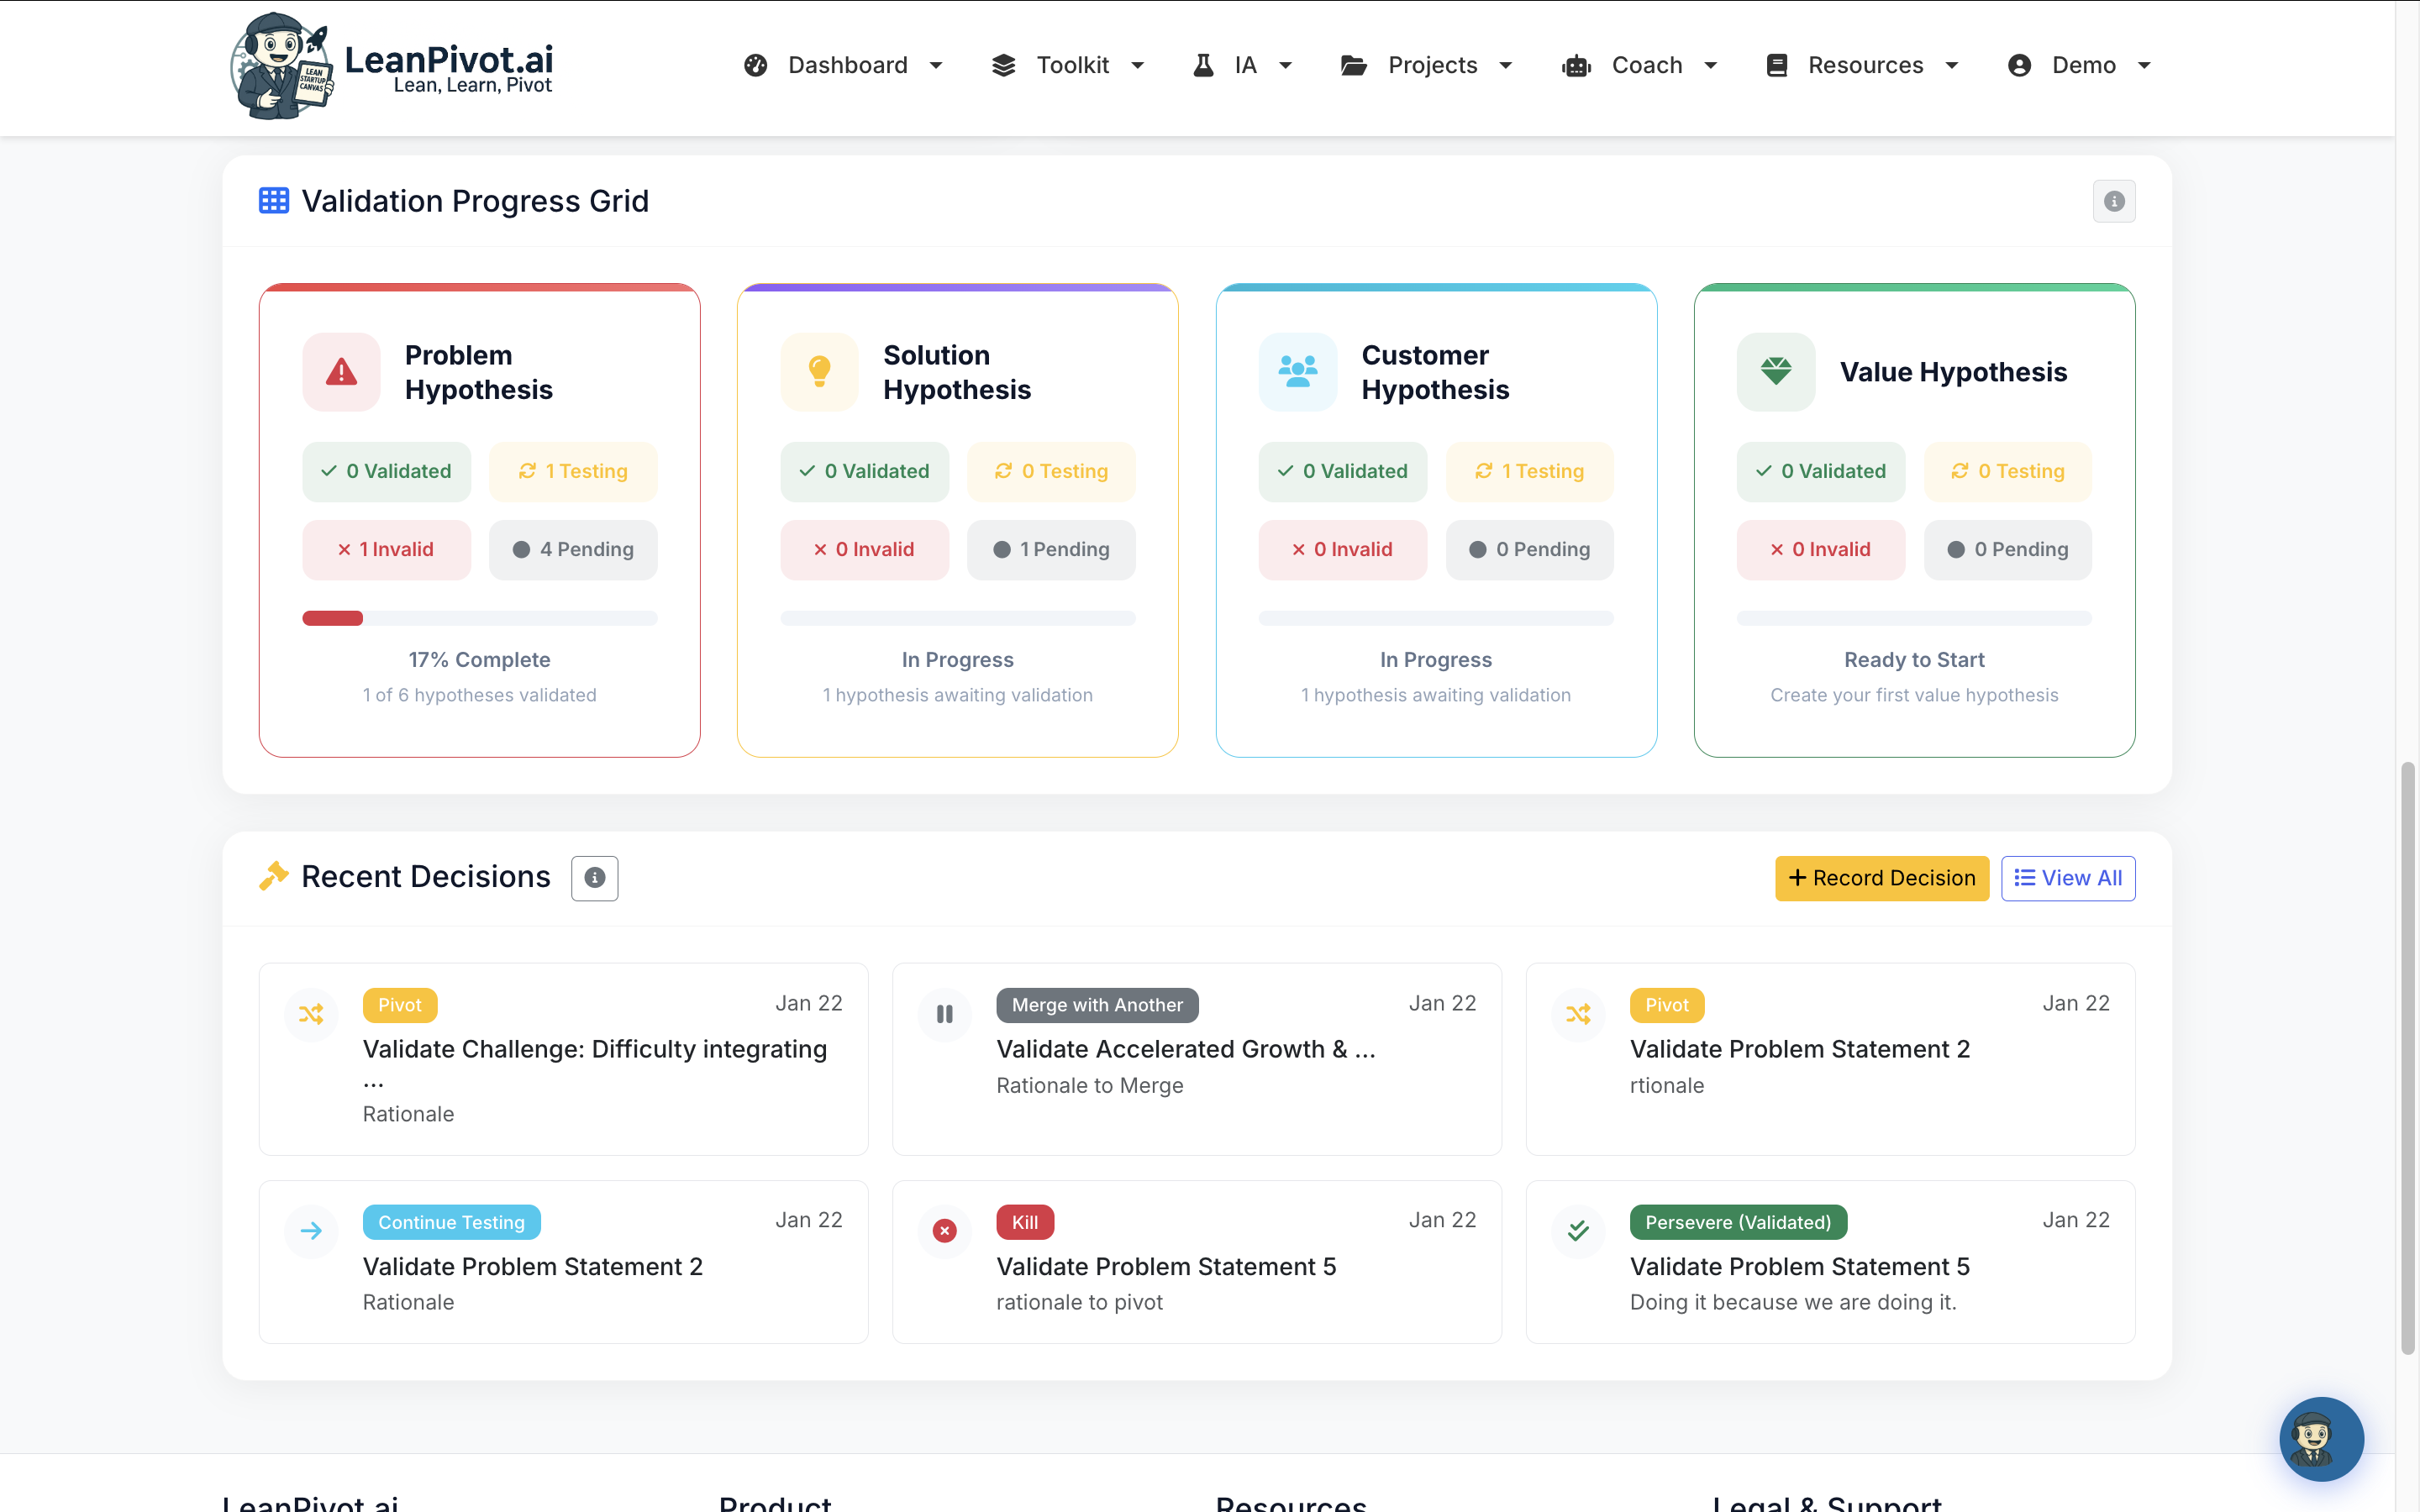
Validation Progress Grid & Matrix
Track validation progress across four critical hypothesis dimensions. Each card shows the status of your hypotheses, with a detailed 4x4 matrix view for deeper insights:
Problem
Is this a real pain point worth solving?
Solution
Does your solution effectively address the problem?
Customer
Have you identified your target market correctly?
Value
Will customers pay for your solution?
Example validation grid showing hypothesis status across four critical dimensions.
NEW: 4x4 Validation Matrix
Dive deeper with our auto-calculated validation matrix that tracks hypotheses across four lifecycle stages:
Auto-detected stages: The system automatically moves your hypotheses through stages based on actual progress--no manual tracking needed. When you add success criteria, it moves to "Define". When you start validating, it moves to "Develop". When validated or invalidated, it moves to "Deliver".
Evidence Levels: From Anecdotal to Definitive
Not all evidence is created equal. Our system automatically tracks your evidence strength:
Early signals. Interesting but not conclusive. Keep testing.
Pattern emerging. Worth investigating further.
Solid foundation. Consider making decisions with caution.
High confidence. Ready for major decisions.
Statistically significant. Confident decision territory.
Risk Assessment: DVF Framework
Every hypothesis is assessed across three critical risk dimensions (Strategyzer methodology):
Desirability
Do customers actually want this?
- Is the problem worth solving?
- Will they pay for a solution?
- Is there strong demand?
Viability
Can you make money from this?
- Is the business model sustainable?
- Are unit economics favorable?
- Is there a path to profitability?
Feasibility
Can you build this?
- Do you have technical capability?
- Are resources available?
- Can you scale if needed?
Score each from 1-5 to prioritize which hypotheses to test first. Always test your highest-risk assumptions first!
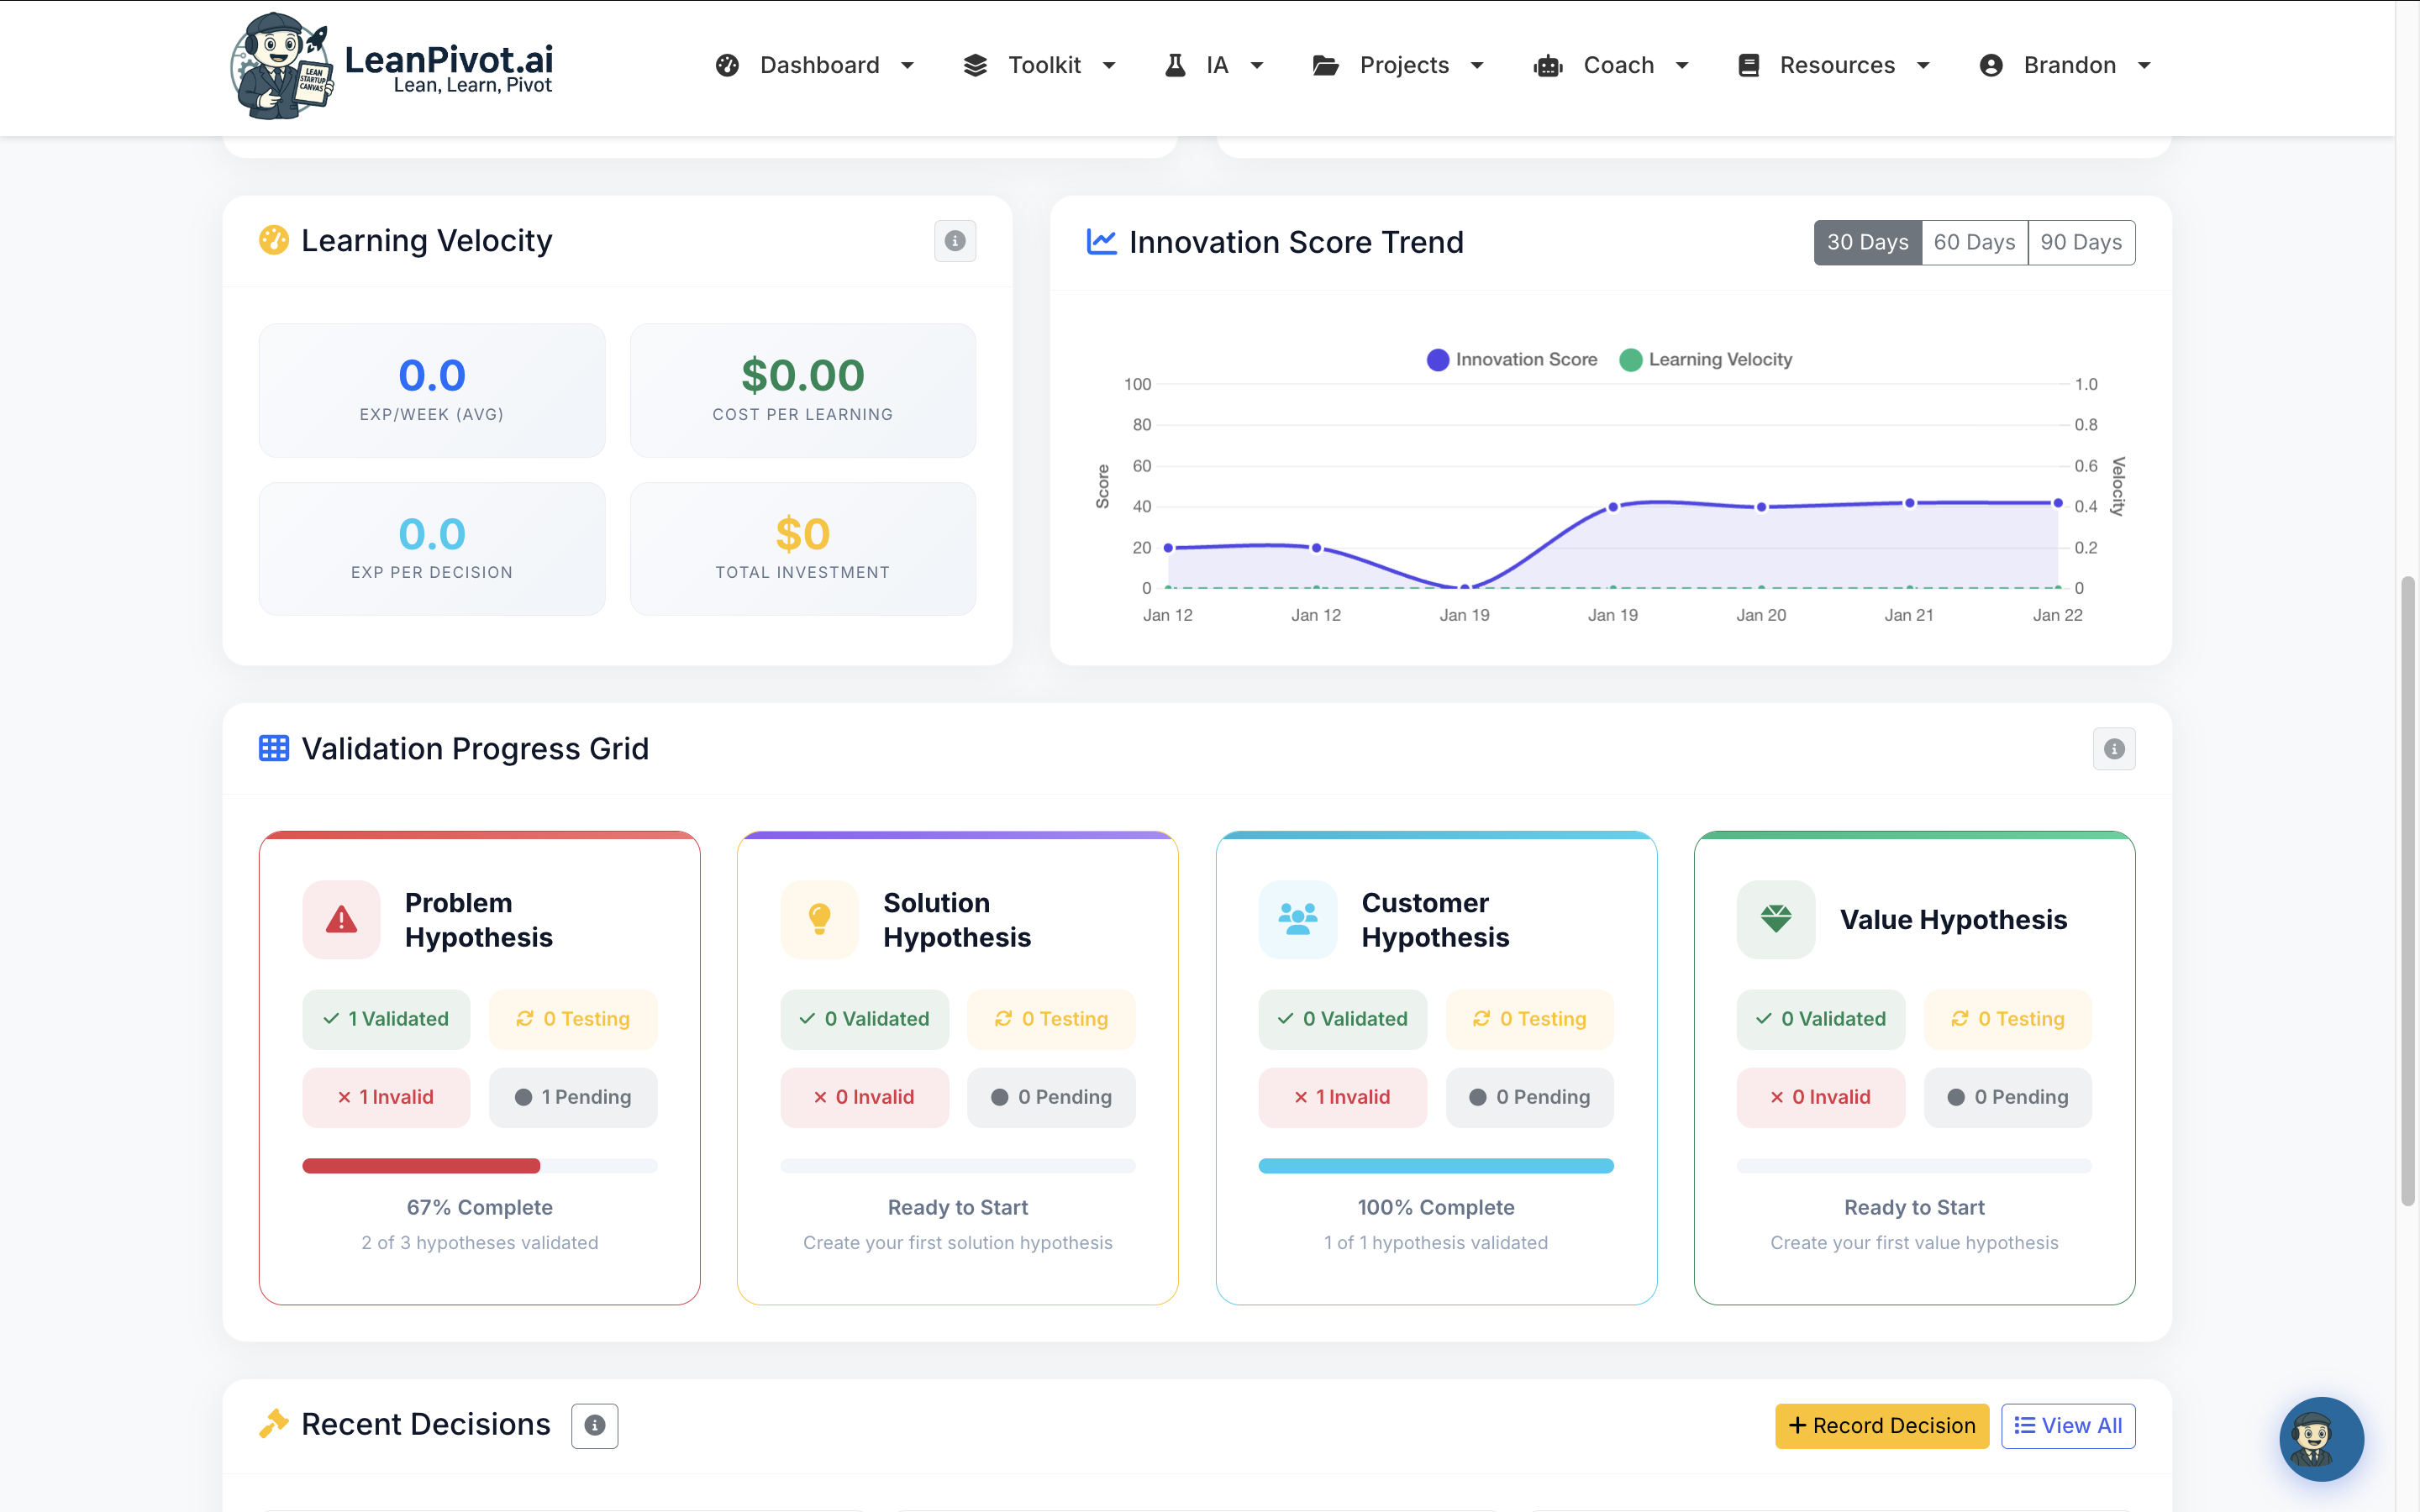
Dashboard & Learning Velocity
Track your validation progress and learning velocity with comprehensive dashboards:
Validation Progress Grid
See your validation progress at a glance across all four dimensions: Problem, Solution, Customer, and Value hypotheses.
- Color-coded status - Instantly see what's validated, in progress, or needs attention
- Progress tracking - Monitor completion rates for each hypothesis type
- Project filtering - Focus on specific projects or view all
What You'll Track (with built-in explanations)
Every metric includes an info button explaining what it means and how to improve it.
- VLE Score - Composite score (0-100) measuring validation effectiveness
- Learning Velocity - How fast you're validating assumptions
- 4x4 Validation Matrix - Hypotheses by type x lifecycle stage
- Experiment Pipeline - Active and completed experiments
- Decision History - All Pivot/Persevere/Kill decisions with rationale
- VML Progression - Validation Maturity Level (1-9) with progress tracking
- OMTM Focus - One Metric That Matters based on your VML level
- Total Investment - Track spend on validation activities
Integrated with SMART & Lean Goals
Innovation Accounting doesn't exist in isolation. It works seamlessly with your goal-setting system:
Decision History & Learning Velocity
Every decision you make is documented and tracked. Build institutional memory that compounds over time.
- Recent Decisions - Quick access to your Pivot/Persevere/Kill history
- Learning Velocity Charts - Track how fast you're validating assumptions
- Innovation Score Trends - Monitor your overall validation progress over 30/60/90 days
Lean Goals Feed Evidence
Your Lean goals (hypotheses) automatically contribute evidence to your Innovation Accounting system. Every experiment, every piece of feedback, builds your evidence base.
Decisions Drive SMART Goals
When you make a "Persevere" decision, you transition to SMART execution goals. When you pivot, your Lean goals update automatically to reflect the new direction.
Real Example: From Gut Feel to Confident Decision
Without Innovation Accounting:
"We've been building this feature for 3 months. Some users seem to like it, others don't. Our investors are asking if we should pivot. We have a team meeting tomorrow and everyone has different opinions. I guess we'll just vote?"
With Innovation Accounting:
"We've tested this hypothesis with 47 customer interviews, 3 smoke tests, and 2 landing page experiments. Our evidence level is 'Strong' (Level 4). Desirability risk has been validated (score: 5/5), but Viability is still uncertain (score: 2/5). We need one more pricing experiment before making a final decision. Our confidence level for a 'Persevere' is currently 72%."
Result: The team has clear, shared data. The decision is evidence-based, defensible, and documented for future reference.
Available on Build Plan & Higher
Innovation Accounting is designed for founders who are actively validating their startup ideas. Available on the Build plan ($15/mo) and higher.
Validation Logic Engine Features
Everything you need to run systematic validation on your startup ideas.
- Hypothesis & experiment tracking
- 4x4 Validation Matrix with auto-calculated stages
- Evidence level auto-calculation
- DVF Risk Assessment framework
- Decision Review system (Pivot/Persevere/Kill)
- Innovation Score & Learning Velocity tracking
- Validation Maturity Level (VML 1-9)
- One Metric That Matters (OMTM) focus
- In-app tooltips & explanations on every metric
- AI coaching integration
Subject to tier-based limits. See pricing for full details.
Ready to Make Better Decisions?
Stop guessing. Start validating. Use Innovation Accounting to build evidence, track learning velocity, and make confident Pivot/Persevere/Kill decisions.
Want to master the theory first? Read the free playbook chapter