As a solopreneur or an early-stage founder, you are likely wearing a dozen hats at any given time. You are the CEO, the lead developer, the marketing manager, and the customer support representative. In this whirlwind of activity, your intuition becomes a trusted companion. You feel like your product is resonating because a few people liked a post; you believe your marketing is working because traffic is up; you think customers are happy because they aren't complaining.
But in the high-stakes world of startups, gut feelings—while vital for initial sparks of creativity—can be dangerous guides for growth. The real differentiator between a venture that scales and one that quietly fades away isn't just a brilliant idea; it’s the ability to rigorously measure progress and learn from what the data is actually telling you.
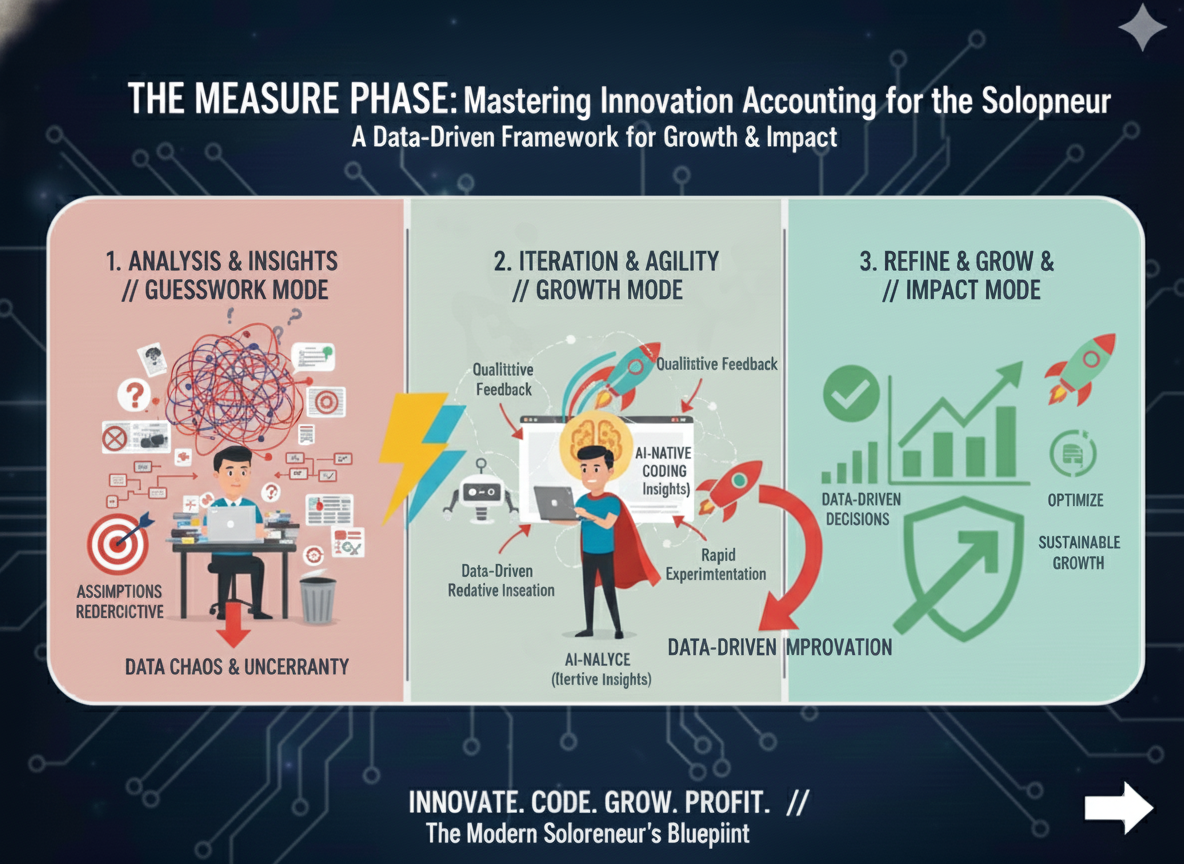
This is the "Measure" phase of the Lean Startup methodology. For bootstrapped founders with limited resources, mastering this phase is non-negotiable. It is about making every dollar and every hour count by focusing on validated learning.
Why "Measure" is Your Startup's Compass
Think of your startup as a ship setting sail for a distant, uncharted island. You have a destination in mind (your vision), and you’ve built a vessel (your MVP). But without a compass, a sextant, and clear charts, you are simply drifting. You might be moving fast, but are you moving toward the island or toward a reef?
The Traditional Plan vs. The Lean Loop
In traditional business, you write a 40-page plan, build the product in secret for a year, and launch with a "Big Bang." In that model, measurement happens at the very end—often when it’s too late to change course. In the Lean Startup model, measurement is continuous. It provides the answers to four critical questions:
- Are we moving in the right direction? Is the product actually solving a problem, or are we building something nobody wants?
- Are we making progress? Are we gaining traction month-over-month, or has growth plateaued?
- What’s working (and what isn’t)? Which marketing channel is actually bringing in paying customers? Which feature is being ignored?
- When should we adjust course? Does the data suggest a minor tweak (iteration) or a fundamental change (pivot)?
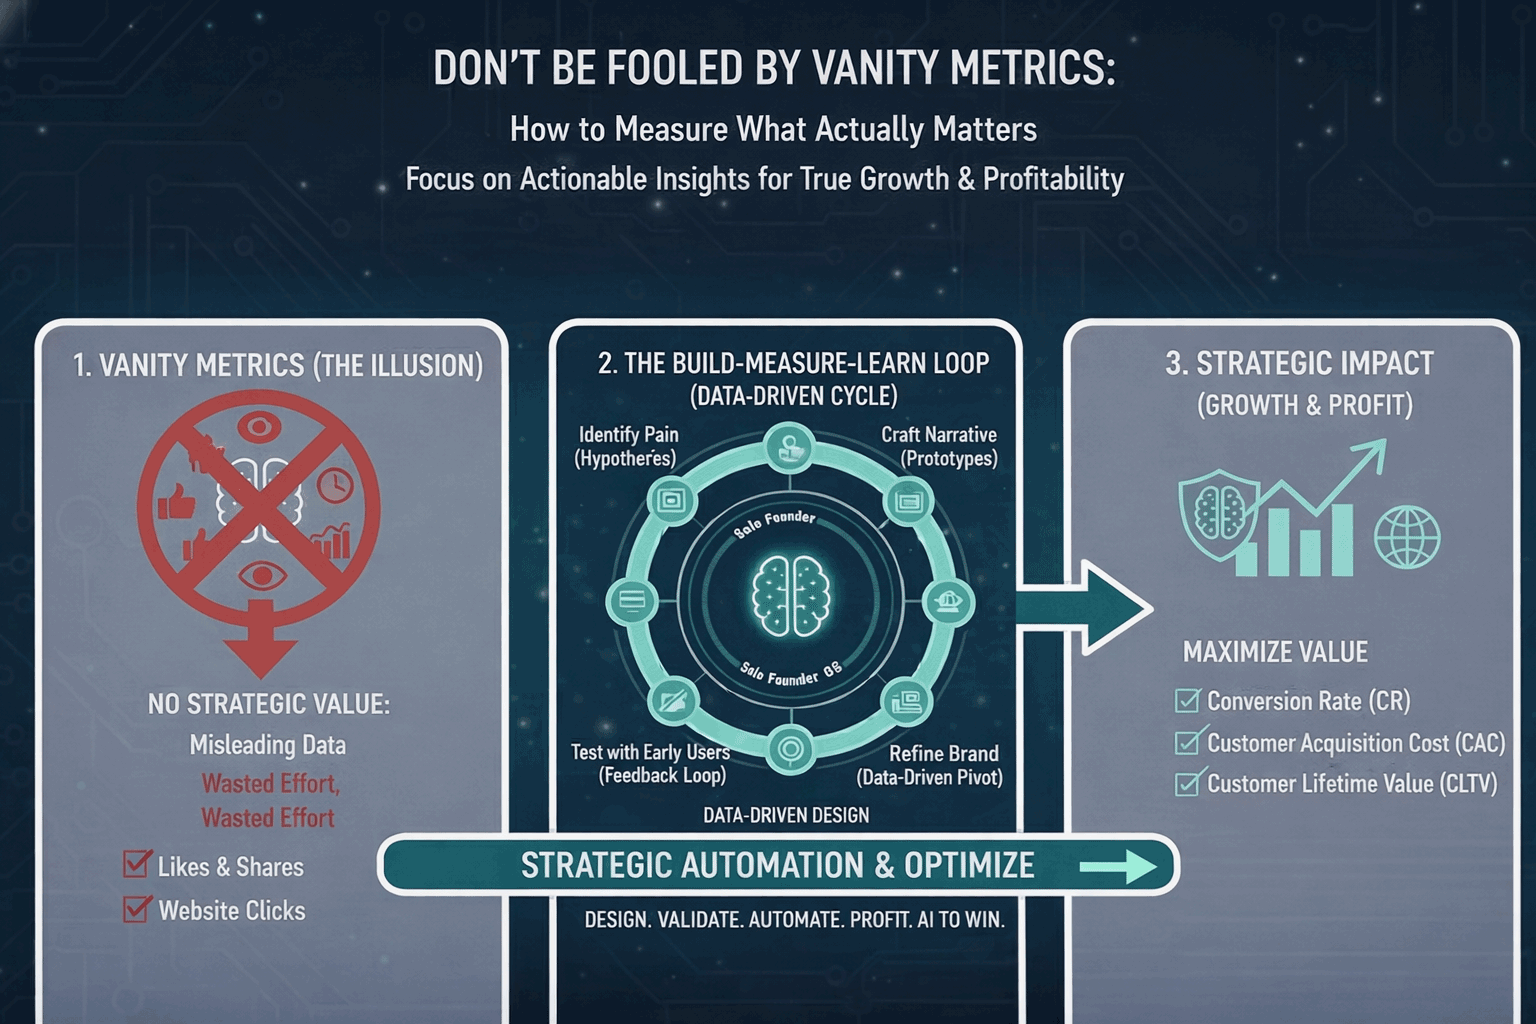
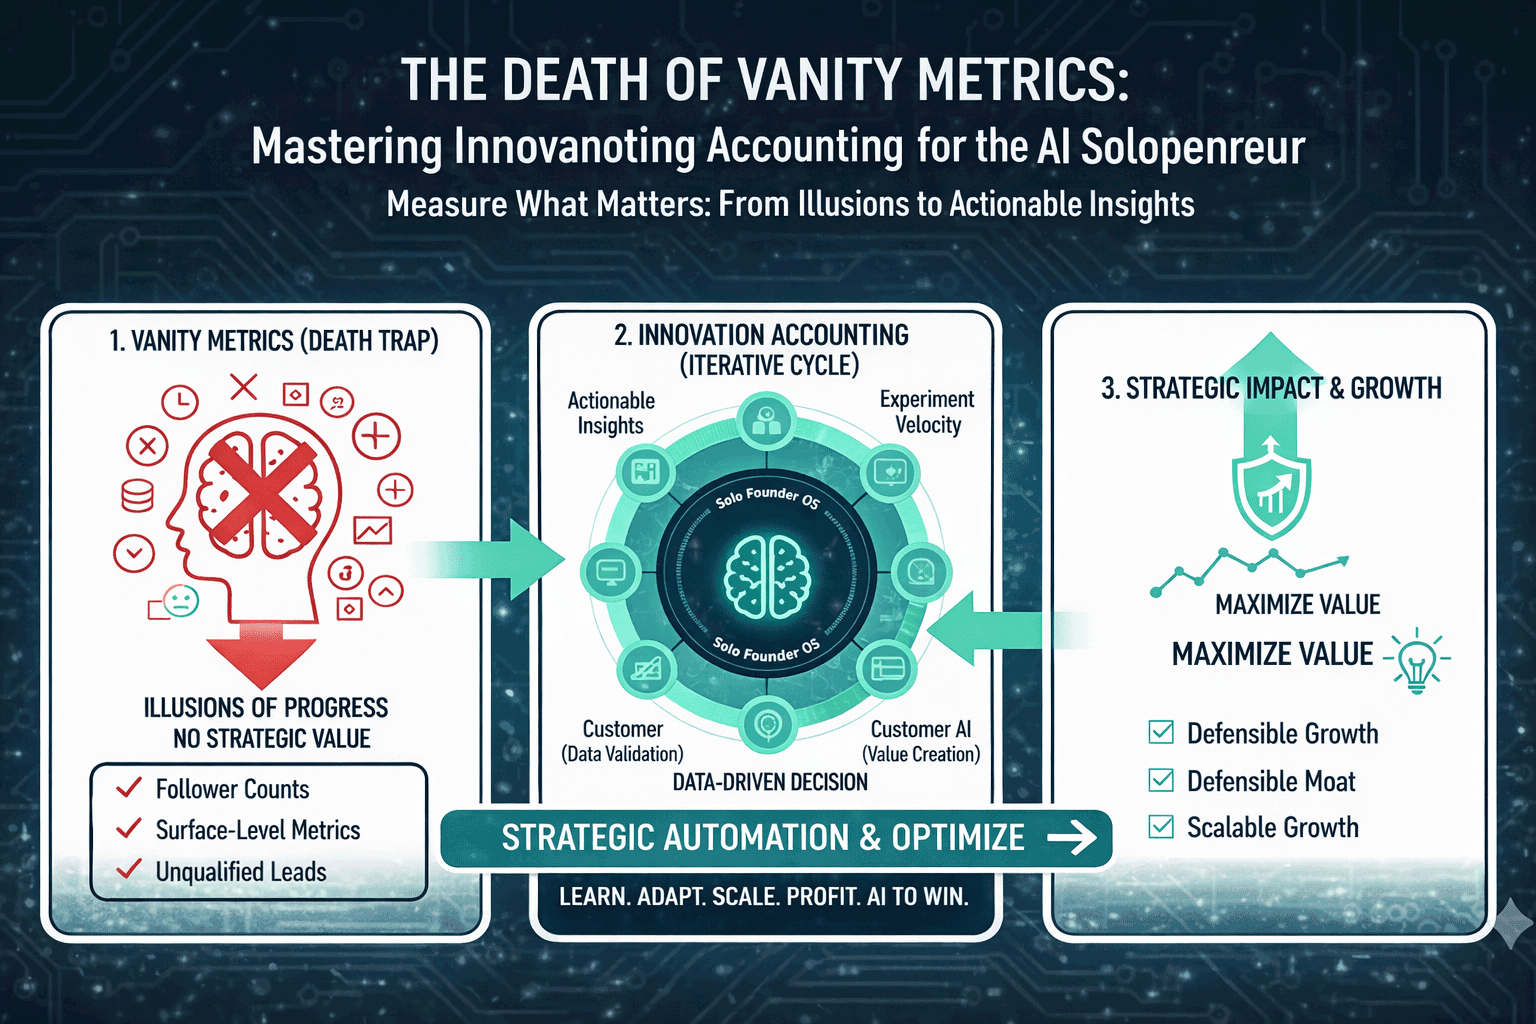
Defining Your North Star: Actionable vs. Vanity Metrics
The biggest trap in the "Measure" phase is falling in love with numbers that don't matter. Eric Ries famously categorized these as "Vanity Metrics."
The Psychology of the Vanity Metric
Vanity metrics are dangerous because they provide a dopamine hit. Seeing "1,000 new followers" feels like success, but if those followers don't engage or buy, they are a distraction. They look great on a slide deck but don't actually correlate to the health of your business.
- Total Registered Users: This looks impressive, but if 95% of those users never log in again after the first day, the number is meaningless.
- Social Media Followers: You can have 100,000 followers and zero sales. Followers are a measure of awareness, not business viability.
- Raw Page Views: If people land on your page and leave within three seconds, your page views are just a measure of how many people you’ve accidentally annoyed.
The Power of Actionable Metrics
Actionable metrics are those that directly inform your decisions. They demonstrate cause and effect. They tell you exactly what to do next.
- Instead of "Users," track "Retention Rate": How many people who signed up 30 days ago are still using the product today?
- Instead of "Page Views," track "Conversion Funnel": Where exactly are people dropping off? Is it the pricing page? The sign-up form?
- Instead of "Followers," track "Referral Rate": How many of your new users were invited by existing users?
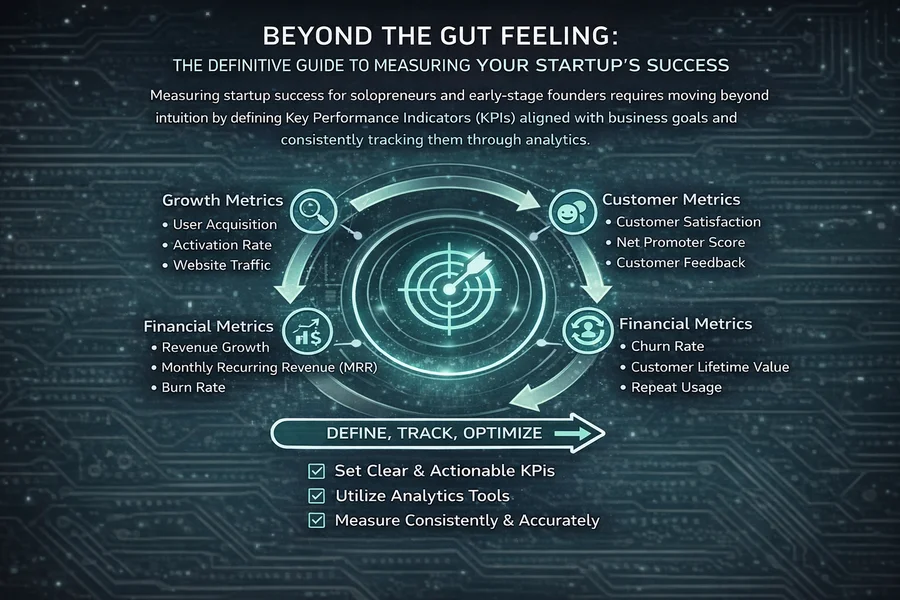
Essential KPIs for the Early-Stage Startup
For a solopreneur, you don't need a 50-page dashboard. You need to focus on a few "Key Performance Indicators" (KPIs) that tell the true story of your journey.
Customer Acquisition Cost (CAC)
How much does it cost you, in marketing and sales effort, to acquire one paying customer?
CAC = (Total Marketing + Sales Expenses) / Number of New Customers Acquired
If you spend $500 on ads and get 10 customers, your CAC is $50. For a bootstrapped startup, understanding your CAC is the difference between survival and bankruptcy.
Customer Lifetime Value (LTV)
How much total revenue will a customer bring in before they stop using your service?
LTV = Average Monthly Revenue per User × Average Customer Lifespan
Churn Rate and Cohort Analysis
Churn is the percentage of customers who leave your service over a specific period.
Churn Rate = (Customers Lost During Period / Customers at Start of Period) × 100
However, raw churn can be misleading. To truly understand churn, you need Cohort Analysis. This involves grouping users by the month they joined. If users who joined in January are staying longer than users who joined in March, you need to ask what changed in the product or the marketing during that time.
The "Aha!" Moment (Activation Rate)
Every successful product has a specific moment where the user realizes its value.
- Facebook: Finding 7 friends in 10 days.
- Slack: Reaching 2,000 sent messages in a team.
- Dropbox: Putting one file in a folder.
Identify your product's "Aha!" moment and track the percentage of new users who reach it. This is your Activation Rate. If this is low, your onboarding process is the bottleneck, not your product's core value.
Building Your Measurement Engine
You don't need a high-priced data team. For a solopreneur, the goal is to set up a "low-maintenance" engine that runs in the background.
From Data to Decisions: Validated Learning
Measurement is only half the battle. The true power of the Lean Startup lies in using that data to drive your next Build iteration. This is the process of "Validated Learning."
The OMTM (One Metric That Matters) Framework
At any given stage of your startup, identify the one metric that is most critical to your survival. Focusing on too many metrics leads to "Analysis Paralysis."
- The Empathy Stage (Pre-MVP): Focus on Problem Validation. How many people interviewed agreed the problem is painful?
- The Stickiness Stage (Post-MVP): Focus on Retention. Are people coming back? If they aren't, don't spend a cent on marketing.
- The Virality Stage: Focus on the Viral Coefficient. Is every user bringing in at least one more user?
- The Revenue Stage: Focus on LTV vs. CAC. Is the business economically viable?
The Data Review Cadence
- Daily: Check for "smoke." Is the site down? Is there a sudden spike in errors?
- Weekly: The "KPI Review." Compare this week's Activation and Churn to last week's. Did your latest feature update move the needle?
- Monthly: Strategic review. Are we hitting our growth targets? Is it time to stop a specific marketing experiment?
Avoiding the Confirmation Bias Trap
The hardest part of the "Measure" phase is being honest with yourself. As a founder, you want the data to be good. This leads to "Confirmation Bias"—the tendency to search for, interpret, and favor information that confirms your existing beliefs.
Conclusion: The Courage to Be Wrong
The "Measure" phase is not about being a math genius or a data scientist. It is about having the courage to look at the truth, even when the truth is disappointing.
As a solopreneur, your time is your most precious resource. Every hour you spend building the "wrong" thing is an hour you can never get back. By building a robust measurement engine, you move beyond guesswork. You stop "hoping" your business will work and start "ensuring" that it does through evidence-based growth.
The goal of measurement isn't to be right; it's to find out exactly where you are wrong so you can fix it.
Check-List: Is Your Measurement Engine Ready?
- [ ] Identify your OMTM: What is the single most important number for your business today?
- [ ] Set up Funnels: Do you know exactly where users drop off between landing on your site and paying you?
- [ ] Calculate your CAC: Do you know to the dollar how much it costs to get a new customer?
- [ ] Define the "Aha!" moment: Have you identified the specific action that correlates with long-term retention?
- [ ] Schedule your Weekly Review: Is there a recurring block on your calendar to analyze the data?
Are the numbers looking good? In the final part of this series, we will look at the "Learn" phase—how to use these insights to decide whether to Persevere or Pivot.
No comments yet
Be the first to share your thoughts on this article!